The small files problem in Spark and Databricks, explained simply
Too many tiny files can quietly slow everything down. Here is what is happening, why it creeps in, and five practical ways to fix it.
A pipeline can process the correct data. The table can look healthy. The job can finish successfully. And performance can still become painfully slow.
Sometimes the problem is not too much data. It is too many tiny files.
This is one of the most common performance issues in Spark and Databricks, and one of the least understood by beginners. It does not throw an error. It does not show up in your data quality checks. It just quietly makes everything slower and more expensive, month after month, until someone finally asks why the table got so sluggish.
Let's fix that. By the end of this article you will know what the small files problem is, why it happens, how to spot it, and five practical ways to fix it.
Same data, different shape
Here is the core idea. Imagine 100 GB of data. You could store it in a few hundred reasonably sized files, or in hundreds of thousands of tiny ones.
The total size is identical. But the second layout is far harder for a distributed engine to process, because every single file carries overhead.
The engine has to discover it, read its metadata, open it, create a task, schedule that task, and coordinate all of that work. With a few hundred large files, that overhead is negligible. With hundreds of thousands of tiny files, managing the files can become a bigger job than processing the data itself.
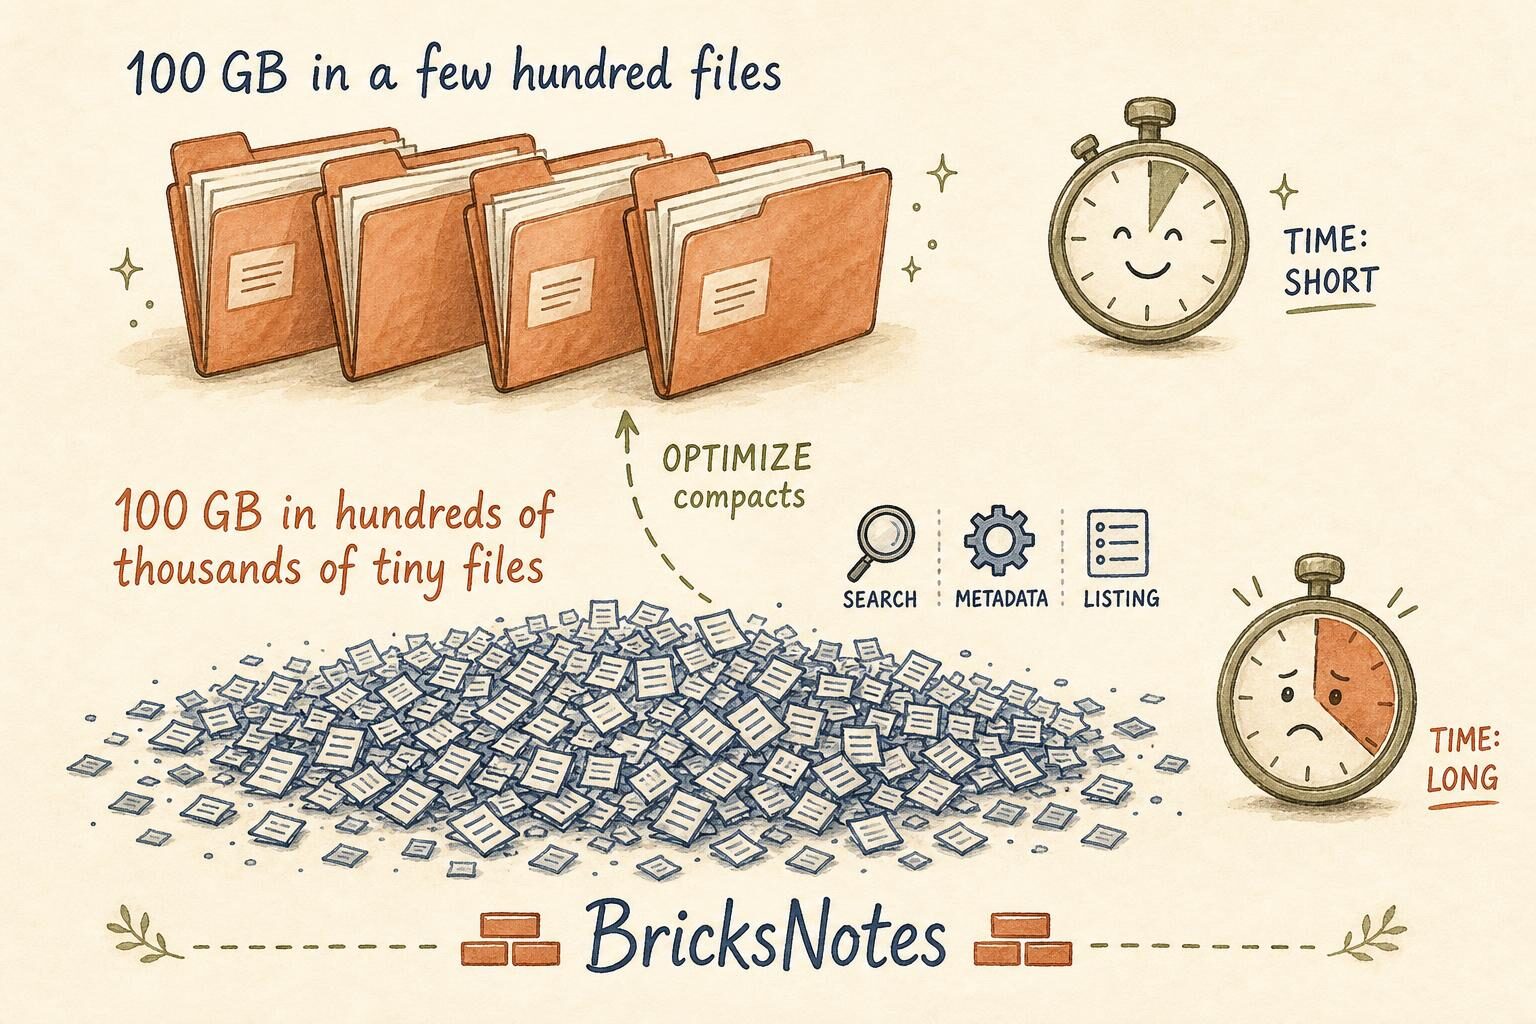
Spark works best when each task has enough data to chew on. When every task reads a tiny file, you get thousands of tasks each doing almost nothing. The cluster spends its time starting and stopping work instead of doing work.
A useful mental picture: reading a book is fast. Reading the same book as 10,000 separate pages handed to you one at a time, each requiring you to walk back to the library desk, is slow. Same words. Very different experience.
How it creeps in
Nobody decides to create a million tiny files. It happens quietly, through perfectly reasonable choices:
Streaming pipelines. A stream that writes a small batch every few seconds creates a small set of files with every micro-batch. Run that for a few months and the file count explodes.Over-partitioned writes. A job writing one file per partition on heavily partitioned data scatters tiny files everywhere. Partition by a high-cardinality column like customer_id and you can end up with millions of folders holding kilobytes each.
Frequent incremental loads. Appending a small amount of data every ten minutes feels efficient. Each append adds new files without cleaning up the old layout.
At first nobody notices. Then queries slow down. Metadata operations climb. Scheduling takes longer. Cloud storage request bills pile up. Months later someone asks why the table got so slow, and the root cause has been building the whole time.
If you want to see this with your own eyes, our small file problem lab reproduces it in a free Databricks workspace in about fifteen minutes: it streams tiny batches into a Delta table on purpose, counts the files, times a query, then fixes the layout and times it again.
Why it hurts more than you expect
The slowdown shows up in places beginners rarely check:
- Query planning. Before Spark reads a single row, it lists the files and reads their footers. Listing 500,000 files in cloud storage can take minutes on its own.
- Task scheduling. Every file becomes one or more tasks. Thousands of tiny tasks mean the scheduler spends its life assigning slivers of work.
- I/O overhead. Each file open has a fixed cost. Tiny files mean you pay that cost constantly for very little data each time.
- Metadata and maintenance. In Delta Lake, the transaction log tracks every file. More files mean a bigger log, slower commits, and slower OPTIMIZE runs.
- Cost. More storage requests, more compute time, more cluster uptime. The bill grows while the data stays the same size.
The tricky part is that everything still works. Results are correct. Jobs succeed. Only the speed and the bill tell the truth.
Five practical fixes
Here is what data engineers actually do about it.
1. Design partitions carefullyDo not partition by a column just because it exists. A good partition column matches how the data is actually queried, and each partition should hold a meaningful amount of data, usually hundreds of megabytes or more. Avoid high-cardinality columns like customer_id; they explode into millions of tiny partitions. Date-based partitions are the classic safe choice for large event tables.
2. Control the number of output partitions
In Spark, the number of partitions at write time often decides how many files get written. repartition and coalesce help you shape this. But be careful: too few partitions creates oversized tasks and memory pressure. The goal is balance, not the smallest possible file count.
3. Compact the files
With Delta Lake, OPTIMIZE combines many small files into fewer, larger ones. Adding ZORDER BY on a frequently filtered column co-locates related rows so queries can skip whole files. The goal is not one giant file. It is a healthy layout for parallel processing, typically files in the hundreds of megabytes. Our articles on fixing a real 100 GB table and on OPTIMIZE and VACUUM in practice walk through this with real numbers.
4. Rethink write frequency
"Real-time" often turns out to mean "five-minute freshness is fine." That one decision dramatically cuts fragmentation. If your downstream dashboard refreshes every fifteen minutes anyway, a thirty-second micro-batch interval buys nothing and costs you file count. Match the write cadence to the actual freshness requirement.
5. Monitor the table itself
Do not just track total size. Track file count, average file size, and files created per run, over time. A table whose file count grows steadily while its data grows slowly is telling you something. Catching it at 10,000 files is a small cleanup. Catching it at 2 million is a project.
Watch the explainer
If you prefer to watch this argument unfold, here is the video version of the same idea:
https://youtu.be/KOJrN1WqKbQ
A quick self-check
You can inspect any Delta table in a few lines:
DESCRIBE DETAIL workspace.default.my_tableThen run OPTIMIZE workspace.default.my_table and check the numbers again. Same data, same compute, better layout. On Free Edition serverless compute this works out of the box, so it is a great first exercise.
The bigger lesson
Big data does not always mean big files. Small files can create very big problems.
The deeper point is one we come back to often in the BricksNotes book: good data engineering is not only about storing the right data. It is about storing it in a shape the engine can process efficiently. Performance is a layout problem before it is a compute problem. Once you see that, you start noticing file layout everywhere: in your partitioning choices, your streaming triggers, your incremental loads.
And if you are designing new tables today, it is worth knowing that Liquid Clustering now handles much of this automatically, adapting the layout as data and query patterns change instead of relying on fixed partitions plus Z-ORDER.
Continue learning
- Lesson: Partitioning and Performance: how partition choices shape every query that follows
- Lesson: Structured Streaming: where tiny files are usually born
- Lesson: Delta Lake: the transaction log, OPTIMIZE, and time travel
- Lesson: Debugging and Monitoring: reading the Spark UI to spot layout problems
- Article: Medallion Architecture Explained: how bronze, silver, and gold layers interact with file layout
- Article: Delta Lake Best Practices: VACUUM, OPTIMIZE, and time travel in production
Take one table you own this week and run the DESCRIBE DETAIL check on it. You might be surprised by what you find, and now you know exactly what to do about it.