The dashboard was wrong before anyone knew. Observability in a Databricks pipeline
Every task was green. The job finished early. The data was still wrong. Here is the monitoring that would have caught it.
The message came from the finance team at 9:40 in the morning.
"The revenue dashboard looks wrong. Yesterday shows almost nothing."
The engineer on duty opened the workflow. Every task was green. The job had started on time, finished in eleven minutes, and reported success. Nothing had failed. No alert had fired. As far as the platform was concerned, the night had gone perfectly.
It took two hours to find the real story. The source system had shipped only one file instead of the usual forty. The pipeline read that one file, processed it correctly, wrote it correctly, and finished early. Everything worked. The data was still wrong.
This is the gap that observability closes. A pipeline that tells you it ran is not the same as a pipeline that tells you it is healthy. If a business user is the first person to notice a problem, you do not have monitoring. You have luck.
Green is a weak signal
Most teams start with one question: did the job fail?
That question catches crashes. It catches a missing table, a bad credential, a syntax error in a notebook. Those failures are loud and easy. They are also the least dangerous kind, because someone finds out immediately.
The expensive failures are quiet. The job succeeds and the data is thin. The job succeeds and a column is now full of nulls. The job succeeds and yesterday's rows were counted twice. We have written about several of these already: duplicate records, silent schema changes, and events that arrive two days late. Every one of those can pass a green run.
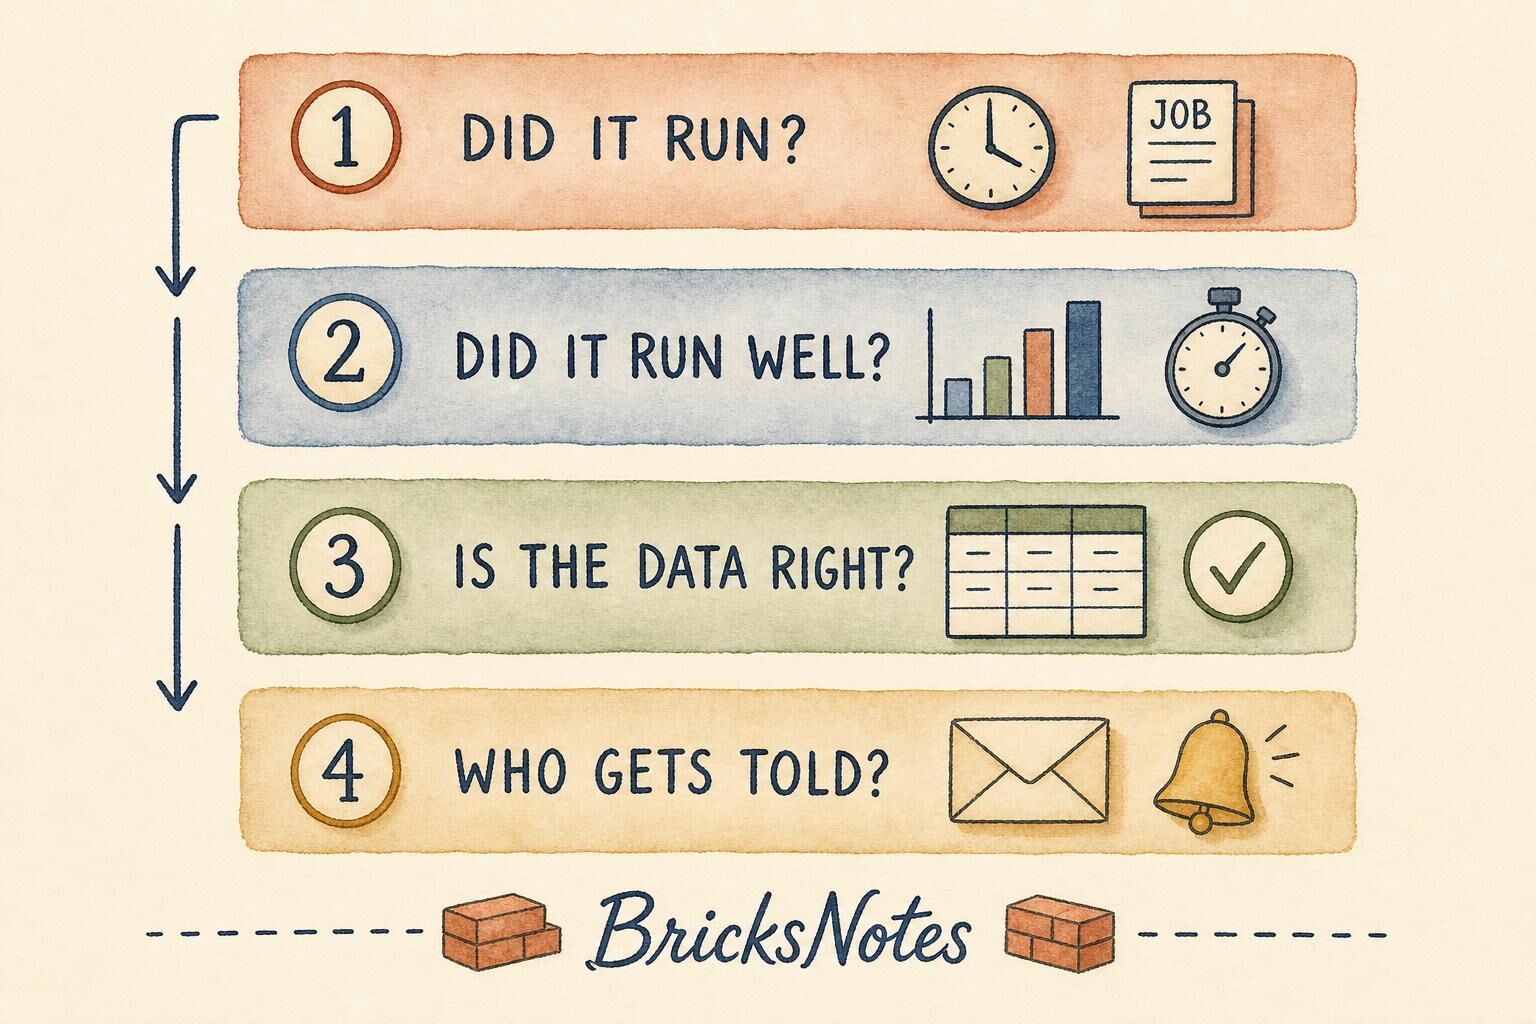
So observability needs to answer four questions, not one.
- Did it run?
- Did it run well?
- Is the data right?
- Who gets told?
Each question needs a different signal. Let us walk them in order.
Question one: did it run?
This is the baseline. A scheduled job should either run on time or tell you it did not.
In Databricks, this lives in Jobs and Pipelines. Every job can send notifications on start, success, and failure. Most teams turn on failure notifications and stop there. Add two more.
The first is a duration guard. A job that normally takes twenty minutes and finishes in two minutes has not gotten faster. It has probably found no data. A job that normally takes twenty minutes and is still running after ninety has probably hit skew or a bad plan.
The second is a missed-run guard. If a job never starts, there is no failure to alert on. Silence looks the same as success. You need something that notices the absence.
The simplest version is a freshness check that runs separately from the pipeline:
SELECT
  MAX(ingested_at) AS last_load,
  TIMESTAMPDIFF(HOUR, MAX(ingested_at), CURRENT_TIMESTAMP()) AS hours_since_load
FROM main.silver.orders
If hours_since_load is larger than your promise to the business, something is wrong, and it does not matter whether the cause was a crash, a paused schedule, or a source that went quiet. This is the check that would have caught the missing file night. The lesson on Jobs and Pipelines walks through the notification and retry settings in the Free Edition workspace.
Question two: did it run well?
A run can succeed and still be sick. The useful signals here are row counts, durations, and cost.
Row counts are the cheapest health metric in data engineering, and almost nobody records them. Write them down on every run:
from pyspark.sql import functions as F

incoming_df = spark.read.table("main.bronze.orders_raw")
incoming_count = incoming_df.count()

run_metrics_df = spark.createDataFrame(
    [(job_run_id, "bronze_to_silver", incoming_count, batch_date)],
    "run_id string, step string, row_count long, batch_date date",
)

run_metrics_df.write.mode("append").saveAsTable("main.ops.pipeline_run_metrics")
One small table, appended once per step per run. After a few weeks you can ask a question you could not ask before:
SELECT
  batch_date,
  row_count,
  AVG(row_count) OVER (
    ORDER BY batch_date
    ROWS BETWEEN 7 PRECEDING AND 1 PRECEDING
  ) AS avg_prior_week
FROM main.ops.pipeline_run_metrics
WHERE step = 'bronze_to_silver'
ORDER BY batch_date DESC
Now a day with 900 rows against a weekly average of 42,000 is visible in one glance. That is the alert the finance team should never have had to send.
Durations matter for the same reason. A step that slowly creeps from four minutes to forty is telling you something about file layout or join strategy long before it becomes an outage. If a single task is the one dragging, read data skew explained. If the whole query got slower after a data growth spurt, query optimization and execution plans is the piece to read next, and Z-ORDER or liquid clustering covers the layout side.
Cost belongs in the same table. A run that doubles in cost with the same row count is a design problem waiting to be found. Lakemeter is about pricing a pipeline before you build it. Run metrics are how you notice the price changing after you built it.
Question three: is the data right?
This is where observability turns into trust. The pipeline can run, run fast, and still hand the business bad numbers.
Delta Lake gives you two levels of defense.
The first is constraints on the table itself. These are enforced at write time, and a violation stops the write:
ALTER TABLE main.silver.orders
  ADD CONSTRAINT order_amount_positive CHECK (order_amount >= 0);

ALTER TABLE main.silver.orders
  ADD CONSTRAINT order_id_present CHECK (order_id IS NOT NULL);
Use constraints for rules that must never be broken. A negative order amount is not a warning, it is a bug, and you would rather fail the load than publish it.
The second level is expectations, which measure quality without necessarily stopping everything. In a Lakeflow Declarative Pipeline that looks like this:
import dlt
from pyspark.sql import functions as F

@dlt.table(name="silver_orders")
@dlt.expect_or_drop("valid_customer", "customer_id IS NOT NULL")
@dlt.expect("recent_order", "order_date >= '2024-01-01'")
def silver_orders():
    return dlt.read_stream("bronze_orders").withColumn(
        "order_amount", F.col("order_amount").cast("decimal(12,2)")
    )
expect_or_drop removes the bad rows and records how many. expect lets them through and records the count anyway, so you can watch a trend instead of blocking a load at 3 a.m. over something cosmetic.
The distinction matters more than the syntax. Ask one question of every rule: if this breaks, do I want to stop, or do I want to know? Stop for correctness. Know for drift. We went deeper on this in the pipeline was green, the numbers were wrong, and the Data Quality lesson has runnable versions of both patterns in Free Edition.
There is one more check that catches an entire class of bugs: compare what you wrote against what you expected to write.
SELECT
  (SELECT COUNT(*) FROM main.bronze.orders_raw WHERE batch_date = '2026-08-30') AS bronze_rows,
  (SELECT COUNT(*) FROM main.silver.orders WHERE batch_date = '2026-08-30') AS silver_rows
Silver should be less than or equal to bronze after cleaning. If silver is larger, you have duplicated something, most likely through a rerun that was not idempotent. That is exactly the failure mode in the job ran twice.
Question four: who gets told, and what do they do?
An alert nobody reads is worse than no alert, because it teaches the team to ignore the channel.
Three rules keep alerting healthy.
Route by severity, not by volume. A failed load to a table the CFO reads at 8 a.m. is a page. A dropped-row expectation at 0.4 percent is a weekly summary line. If both land in the same channel with the same tone, people stop reading both.
Make the alert carry context. "Job 4471 failed" costs the responder fifteen minutes of clicking. "bronze_to_silver failed on batch_date 2026-08-30, step 2 of 4, last successful run 2026-08-29, 0 rows read from the landing volume" almost solves itself.
Write the runbook next to the pipeline, not in someone's head. Four lines is enough for most steps: what this step does, what breaks most often, how to check, how to safely rerun. That last line is the one people need at 3 a.m., and it is only safe to write if your pipeline can be rerun without damage. If you are not sure yours can, start with safe reruns and how to backfill without breaking downstream tables.
When something did go wrong
Observability tells you there is a problem. Delta Lake helps you see what happened.
DESCRIBE HISTORY main.silver.orders;That history shows every version, the operation that created it, and how many rows it touched. It is the fastest way to answer "what changed last night" and it is available on every Delta table with no setup. If a bad write did land, you can read the table as it was before:
SELECT COUNT(*) FROM main.silver.orders VERSION AS OF 118;The Delta Lake lesson covers history, time travel, and restore in detail, and the Debugging and Monitoring lesson walks through reading the Spark UI when a run is slow rather than wrong.
Unity Catalog closes the loop on the other question incidents always raise: who else is affected? Lineage shows which downstream tables and dashboards read the table you just fixed, so you can tell people before they find out on their own. That is the difference between an incident and a surprise. The Unity Catalog lesson has the walkthrough.
A modest starting point
You do not need a monitoring platform to get most of this value. Start with four things this week.
One freshness query per critical table, scheduled hourly. One run-metrics table that every pipeline appends to. Two Delta constraints on your most trusted table, covering the rules that must never break. One alert with real context in it, routed to a channel people actually read.
That is an afternoon of work, and it moves you from "the dashboard looks wrong" to "we already knew, and here is what we did."
The mindset behind it is the part worth keeping. A pipeline is not finished when it produces the right answer once. It is finished when it can tell you, without being asked, whether today's answer can be trusted. That habit is what separates a script that works from a system people rely on.
Continue learning
- Jobs and Pipelines — schedules, retries, and notifications in Free Edition
- Data Quality — constraints, expectations, and quarantine patterns
- Debugging and Monitoring — reading the Spark UI when a run goes slow
- Delta Lake — history, time travel, and restore
- The pipeline was green. The numbers were wrong.
- The job ran twice
- Your first data engineering project in Databricks Free Edition